I love delving into esoteric mysteries, but in these days of mass marketing and the "New Age" , what was originally intended as profound and enlightening, becomes trite and banal. Thats why I often like a bit of black humour with my enlightenment. Hence - "I think, therefore I am depressed". :)
I am actually on the road at the moment; a mission to remind my relatives why they should not visit me for extended periods... achieved with minimal cost by me visiting them. lol
So sans the luxury of my office, multiple monitors, broadband connection, etc, my blog offerings will reside more in the whimsical than the rational for a few days... if indeed, my posts are ever rational.
*So in keeping with the esoteric theme, some musings on Gann, time & price from an old internet adversary and flame warrior, Grant MacDonald. Well past me I'm afraid, but this guys views are always challenging to the prevailing dogma, and therefore interesting.
*Not exactly esoteric, but mysterious nonetheless, Adam Warner shads some light on the workings of the VIX over the last few days. Here, here & here.
*As a token commentary on the futures markets, coffee is looking bullish once more, prompting some interest from at least one brokerage blog.
*The stock indicies and the Dollar Index are keeping things interesting for economic prognosticators (*click any financial link for comments on that)
Cheers
Tuesday, November 28, 2006
Friday, November 24, 2006
Dollar Dazzler
 Not too long ago, I saw a video of a presentation by Larry Kudlow that was floating around the web. Basically he was a lone Dollar bull in a hostile room full of bears. He put on a great show, and was even quite convincing. But nobody believed him anyway. lol
I'm not formally educated in economics so I rely on articles and opinions that are sufficiently dumbed down enough for me to understand. So what I'm saying here is I'm no expert, not even well versed in the principles of economic managent.
But I must say I am most impressed by the case presented by the bears... both on the dollar and on the economy (that includes us in the rest of the English speaking world as well).
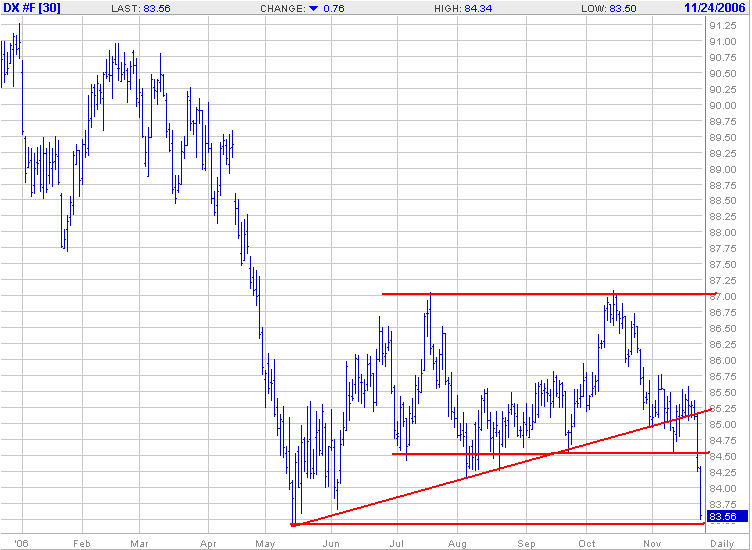 So I guess I'm saying that I'm not shocked that the DX is testing some important support levels on the chart. My only lament is not taking the trade.
Where my bemusement lies is in the the stock indice's, where apparently any news is good news, so long as rates stay paused... a slowing economy is apparently bullish... but I won't put the kibosh on that one.
Thursday, November 23, 2006
Gold is Just a Commodity
This news seals it for me:
Pressure grows on IMF to sell some gold stores
SINGAPORE: The International Monetary Fund, one of the world's largest holders of gold, should sell some of its hoard to cover projected operating losses, say a growing number of the fund's executive directors.
The Washington-based lender predicts that it will lose $87.5 million next year and $280 million in 2009. Some directors say the fund should sell a portion of its 103 million ounces of gold, which are valued at $64.7 billion, and invest the proceeds in interest- bearing assets.
"We would support the use of fund gold as part of the solution to IMF financial needs," Tuomas Saarenheimo of Finland, chairman of a group that coordinates the position of European Union members on the fund's 24-member board, said during an interview in Washington.
The prospect of gold sales highlights the crunch faced by the fund as countries like Uruguay repay loans early, reducing interest income, and demand for fresh credit ebbs. Proponents must overcome opposition from the United States, the biggest owner of gold, which wants to keep prices high.... MORE ====>>
Wednesday, November 22, 2006
Real Money?
 I don't know how many arguments I've sat through between the antagonists and protagonists of the "Gold is the only true currency" dogma. In such instances I feign some sage-like loftiness as to being above such materialistic concepts (when in reality the discussion is well over my head, I don't have a clue. lol)
I can only default to my observations; sometimes it acts like a currency, sometimes like a commodity. In the last few months at least, the reverse correlation to the USD index is quite striking, as per the chart on the left.
Without drawing all those tiresome lines all over the chart, technicians will recognize the short-term trading signals (all depending on time frame and style of course), long gold, short the dollar index.
So the question today is, whether to take both trades, or is it really the same trade? Is long gold really short the dollar by default?
For now, my thoughts are kill two birds with one stone, and gold is sexier than USD's, so I'm with gold, and hoping for a breakout of the recent highs.
Tuesday, November 21, 2006
A Nuclear Winter in Base Metals?
Nothing really startling happening around the futures markets today. Energies Bouncing a bit, hogs continuing up. Gold looks interesting for a long, that's about it as far as anything exciting.
A good time to dive into a 25 page PDF on base metals I found on Kitcometals titled:
The Coming Nuclear Winter Base Metals
It's a view I broadly subscribe to and despite the unpleasant imagery in the title and some arguable assertions in the text, an interesting read for the holders of base metal miners like FCX/PD, BHP, TCK and the like.
Check it out.
Monday, November 20, 2006
Lean Hogs
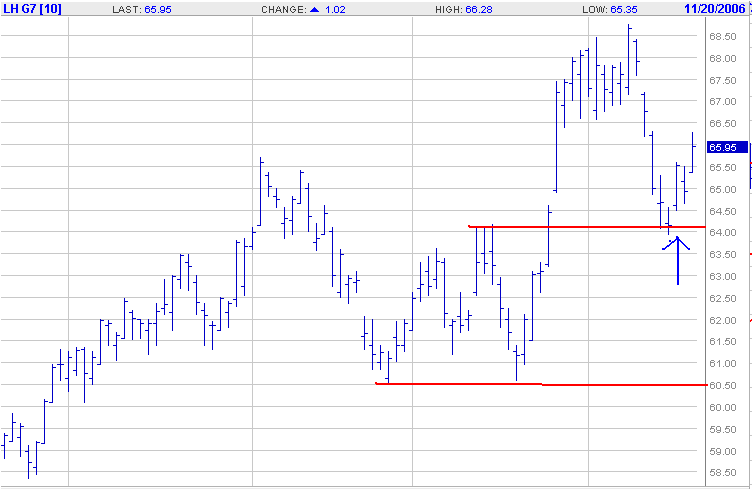 Last Wednesday I was having a look at a possible "resistance becomes support" scenario in the February Lean Hogs.
In fact hogs have moved nicely off that level to become a textbook example of this nuance of price action. The fib retracement traders will also be claiming this one as well as it is in the 50% retracement region that most look for. I'm hoping at this stage that price action holds up long enough to for this to be a textbook example... and anyone long some calls will appreciate that too. :)
Not withstanding that resistance often does often become support, I never have had a satisfactory answer as to why this happens. It's good enough for me that it just works as far as trading goes; but the vacant stare on my face is not a good look when someone asks me this very question.
Anyone with an answer? I'd be much obliged.
Not So Fast With The Price Rise Mr Barista
 Last week I opined that I would really have to get my trading act together to cope in the potential price rise at Mrs's favourite cafe'. A happy wife is a happy life, so rather than put the khyber on her cafe' society spending, I'll just have to step up my trading performance.
That must mean even more trend-lines right? LOL
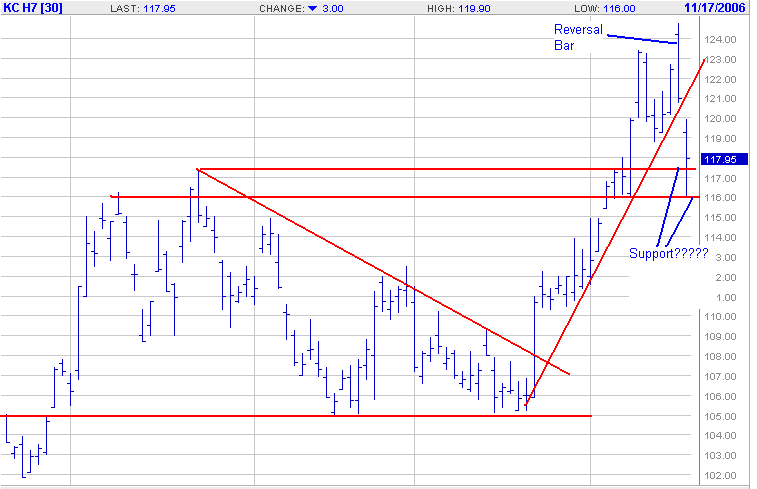
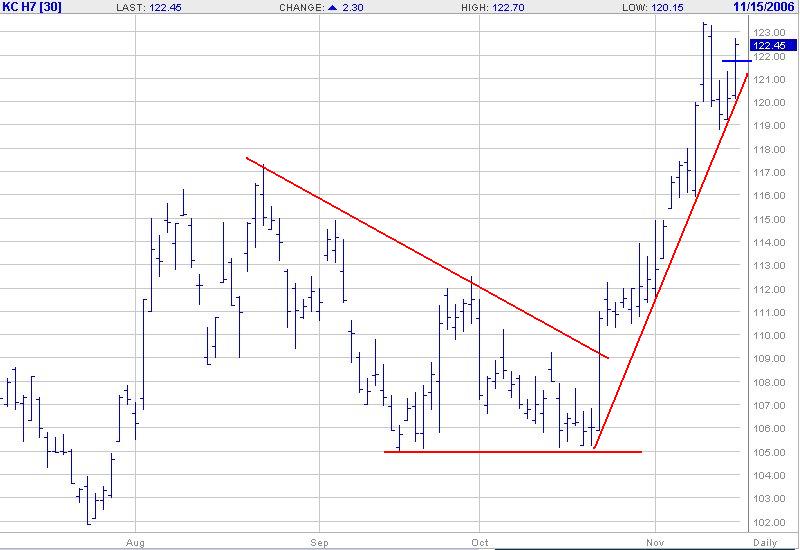
Thursdays bar was a grade A reversal, with some solid resistance at the ~125 level for this contract* (not shown on this chart) triggering some solid selling to close lower for the day.
*N.B. Drawing horizontal trendlines can be a challenge with futures because of the cost of carry/contango/backwardation. What mat be a lovely support or resistance on the individual contract, might not be valid on a continuous chart and visa-versa. So a grain of salt is required.
Friday saw the month old trend-line broken with conviction but with some buying off the lows and closing above the August resistance areas (now support?)
My view of support and resistance goes something like this: Support (resistance) isn't support until there is support. In other words, I am watching price action around these arbitrarily drawn lines on the chart for low risk entries (or pyramiding opportunities).
So is there support at the support in this March
 coffee contract. There is some evidence but no "case closed" yet, and there's still the fib levels below here.
The next question is, is whether this market is in an "El Toro Grande" ( To steal Stuie Johnstons terminology) or just trading within a somewhat messy range?
It is a question that can only be answered with certainty, in retrospect: But one must put their chips on the table.... and if Alfredo the Barista is going to end up charging a fiver for a cup of coffee, I am going to slap that fiver on the counter with fiscal impunity, dammit!
Friday, November 17, 2006
Bugger Commodities
How about Commodities Exchanges!!
Marketwatch: Nymex IPO rallies more than 100%

Marketwatch: Nymex IPO rallies more than 100%
NMX135.95, +76.95, +130.4% ) IPO is up more than 100% after opening at $120, above its $59 price. The stck gained strength in the open market by rising to $140 a share. The performance marks the best opening-day gain by a U.S.-based new issue since Transmeta (TMTA :Nymex is the exchange where the energy and various metals contracts trade. I wish I had bragging rights for having subscribed to this, bus alas, no.transmeta corp del com
Whither To, Copper?
 Copper has undoubtedly been one of the big stories in recent commodities boom, due in no small part to the China story. Many analysts are predicting a perpetual bull in the base metals because of the increasing demand from China and other Asian economies.
I've never been so sure. The cycles in these things always seem to have their way in the end.
The question with copper (and other base metals) is; It this the end for now? It is often remarked that base metals are a good barometer for the health of world economies and as such, things look a tad shabby technically. There was an important technical break-down only a few days ago, to arrive at this point of possible support. (well, we're a few ticks above it)
What copper does here will probably say a lot, particularly about copper, but about the the perpetual economic growth dogma that prevails today. (If the economic barometer thing is to be believed)
On the other hand, it could just be speculative heat coming out of the market.
Either way, it's do or die for copper right about here.
Thursday, November 16, 2006
Train Stories
Freight Train of the Day
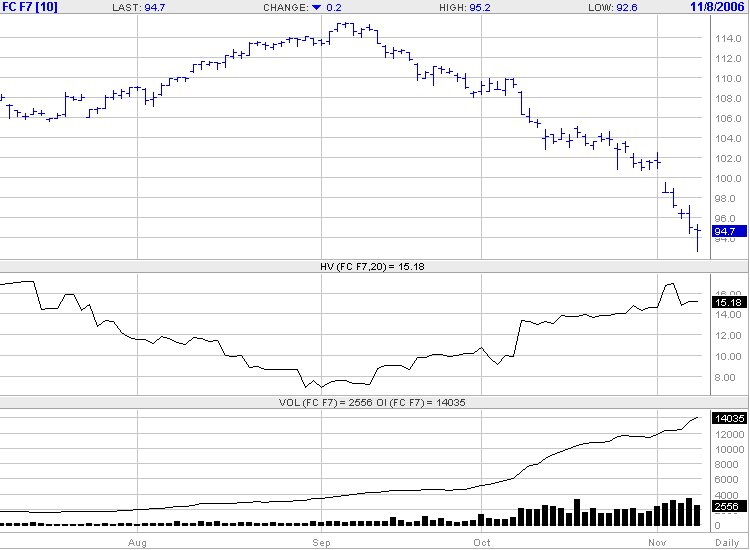
Frozen Concentrated Orange Juice - Getting very close to the all time high today, closing up 8.55c @ 205c on the January contract. This is a commodity that was around 50-60c in 2004 so anyone with a trend following system and nice wide trailing stop is making a motza out of this contract. Sad to say thats not me.
Train Wreck of the Day
Crude Oil - This is a market that many traders say should be rallying... including me :( My "glitch" turned out to be a derailment. As luck would have it, it happens to be the most dreadful looking chart of the energies. Unleaded, Heating Oil and Natural Gas maintain their basing patterns whereas the bottom has dropped out of crude. I still maintain a position with some adjustments to further limit losses while maintaining upside potential.
Dollar Update - Bullish?
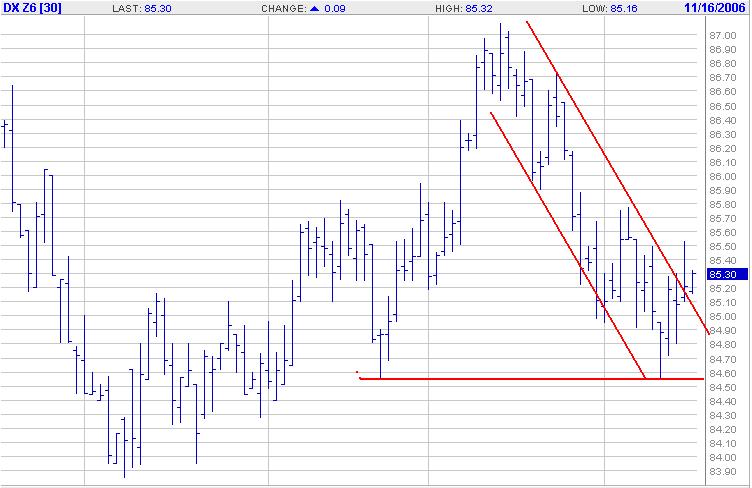 Well at least not bearish. It looks at this stage to be supported @ 84.50 and has edged sideways out of the channel I have drawn in.
I'm a bit questioning of the Bull case here because of the technical picture of the basket of currencies the USD Index trades against. They either look bullish or look to have support in most cases.
I'm not really convinced, so no position in the USD.
The Aussie however, looks like a nice long setup. (Dynamically updating chart)
Oh No! Please don't say coffee is going up!
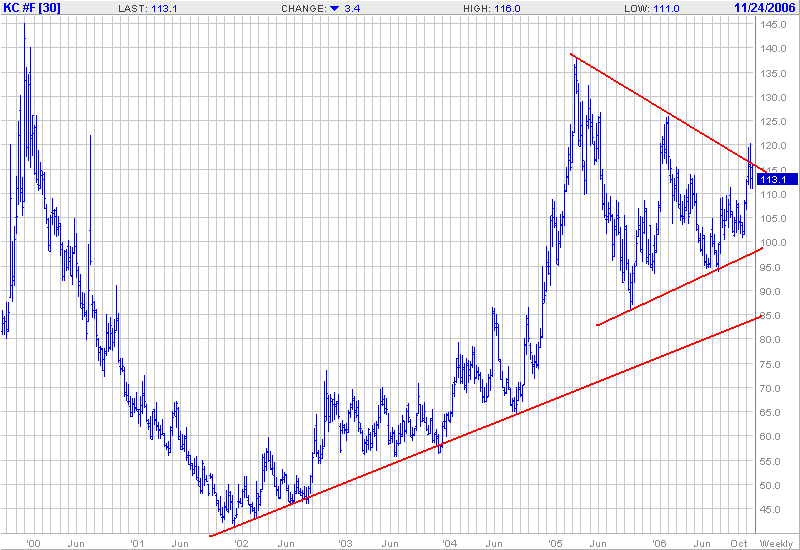
 Could we be looking at yet another big commodity bull in coffee?
London Robusta coffee has been in a solid uptrend since August that was not replicated in the New York Arabica contract... until late last month.
A big bullish bar off the double bottom punched through the downsloping resistance, launching quite a strong move upwards.
I was expecting a bit more retracement as a spot to possibly to some pyramiding, but yesterdays move off the trendline looks incredibly bullish. I just don't know whether its a good spot to add. But a strong bull doesn't hang about to offer traders a nice comfortable entry... case in point; corn.
If this takes off, so will volatility, so optioneers might want to get long some vega.
I am however, bracing myself for a price rise at my wife's favourite coffee shop. It might just cost me all my profits from trading this contract. :-o
Treasuries and the Yield Curve
Barry Ritholtz highlights the US treasury yield curve this morning.
Plenty of irony in the comments too. :)
It seems that the bond market is saying "hard landing" as stocks say: "What, me worry?"One of the reasons I think the stock market looks a bit frothy.
Plenty of irony in the comments too. :)
Wednesday, November 15, 2006
Lean Hogs - Resistance becomes Support?
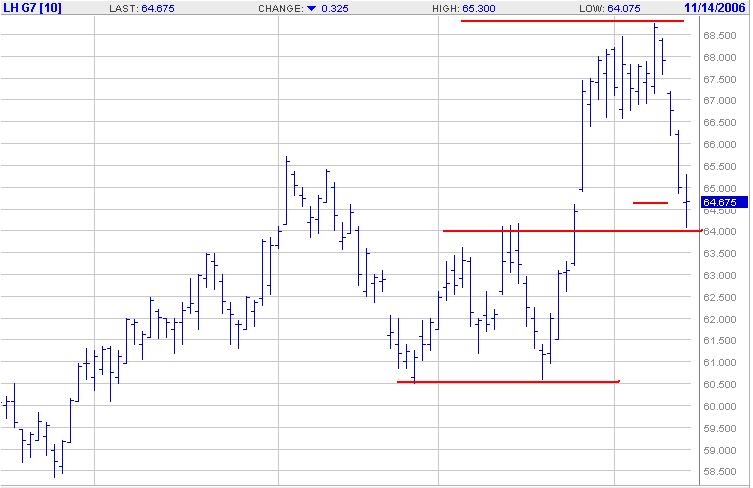 Lean Hogs have sold off quite viciously from the highs of this month - a classic headfake out of consolidation and selloff, described as a train wreck by Jim Wyckoff.
I wouldn't go that far(yet) as this Feb Hogs chart looks far from bearish in my opinion. If Hogs get support here, it will be at a previous resistance level and at ~50% fib retracement. If this is just a retracement, then it is right here where we want to see support... or 63.77 at the lowest.
It's a tad early to call a long opportunity, but just a heads up. IV's are on the cheapish side so optioneers might be looking on the buy side of the equation.
Tuesday, November 14, 2006
BUY DIPS!
 As the S&P 500 hit new highs again, at this point, that backspread strategy made a lot of sense. It has allowed me to be wrong, but right anyway.
I keep thinking I have stumbled into some parallel universe where normal market behaviour has been suspended and any news sends the market higher. Good News is obviously good news. Bad news, is also apparently good news. A slowing economy is bullish.
Shades of Animal House.
T-Bond Top?
Been looking at the overhead resistance in bonds and waiting for a trading opportunity. Here is an Article from Jim Wyckoff posted at Commodity Trader for the technical picture:
U.S. T-Bonds Up Against Stiff Overhead Resistance
U.S. T-Bonds Up Against Stiff Overhead Resistance
Dollar - Which Way?
 Last Friday, I mused that the US Dollar Index was at a pivotal juncture with regards to the technical picture.
Pivotal was the correct term, because thats exactly what it did at the support I had drawn in - pivot. This isn't necessarily bullish... yet. There is a month old downward channel to contend with as drawn in on the left. That horizontal support at 84.50ish is still key and a move out of this channel will validate that support and essentially set a bullish path in the medium term.
On the other hand, most of the currencies the USD trades against look technically bullish as well. A move down today continues the channel.
Which way?
Monday, November 13, 2006
VIX Deceased
I have mentioned in earlier posts that I have stopped looking at leading indicators such as put/call ratios, VIX etc as they stopped making any sense, sans any sort of normal wave structure in the stock indicies.
Only one thing made sense - buy dips; not retracements, they don't exist anymore, dips. Any dip!
Old habits die hard, so today I once again perused the VIX for any sign of activity, to find that, ironically, it slipped away in the night, unnoticed by anyone.
Anyway, nobody needs me to tell them that S&P 500 IV's are at basically their minimum value. We have not seems them much lower... ever. Adam Warner has discussed VIX at length over at The Daily Options Report, so have a look there for a comprehensive run-down.
Minimum value is a concept I like to use in the commodities markets. When cocoa producers start burning there crops in the streets as they did a few years ago in the Ivory Coast, it's time to take a position.
So can that logic be extended to stock market volatilities? I think so, but cautiously so, as all logic has apparently been suspended. Buying cheap volatility, of course means buying puts, because it is from downside where we will get a lift in vols.
Hmmm well there is that potential double/triple top.... the election is past.... the bears are looking a bit more credible.
However, the bobbleheads are talking up a storm (as ever), oil refuses to rise despite my best analysis, and apparently a slowing economy (and therefore a pause) is bullish!
Confounding!
There is a strategy that suits low volatilities, is long vega on the downside and can be profitable even if the SP goes up - the "reverse ratio spread" (aka "put backspread"). We short ITM puts and buy OTM puts in a ratio (usually 2:1 but can be any ratio... 3:2, 3:1 whatever)
The risk is similar to a long straddle and maximum loss is at the bought strike.
I'll talk more about this in the coming days as we watch how this market shapes up.
Cracks in Copper
Many of my commodity trading colleagues (and those who trade them via share-market proxies) are relentlessly bullish on base and precious metals. The secular trend in these metals makes it difficult to argue with them without appearing to be a total neg-head.
They will point to the fundamentals of ever increasing demand and dwindling supply. The opinions of one Jim Rodgers gives them great heart and courage of their convictions.
They could be right, but I'm not a believer on two fronts. 1/I think we are headed for a recession (I will leave the argument on that front to more formally educated pundits) and 2/ Psychologically I don't want to be a believer in anything. I just want to trade what I see, without bias.
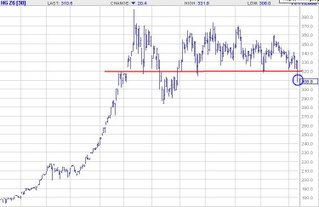 Which brings me to the point of this post - Copper.
Many view copper as a barometer for the global economy and particularly, a barometer for the health of the China economy. I don't necessarily agree with that, but it has to be a barometer for something. As such Fridays price action must surely be viewed as a shot across the bow of whatever copper is a barometer of.
I don't follow the base metals not tradable on the US futures markets, (such as zinc, nickel, lead etc) but apparently they have taken a bit of a hit as well.
Anyway, I think it is technically significant, and copper on the electronic market is down further this morning, the Dec contract trading a short time ago at 302.50. Base metal bears may now have something to put the wind up all those relentless bulls.
Early days yet.
They will point to the fundamentals of ever increasing demand and dwindling supply. The opinions of one Jim Rodgers gives them great heart and courage of their convictions.
They could be right, but I'm not a believer on two fronts. 1/I think we are headed for a recession (I will leave the argument on that front to more formally educated pundits) and 2/ Psychologically I don't want to be a believer in anything. I just want to trade what I see, without bias.
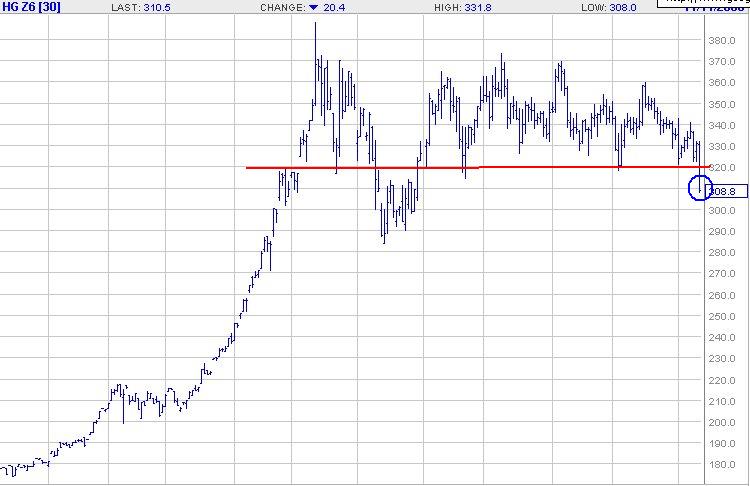 Which brings me to the point of this post - Copper.
Many view copper as a barometer for the global economy and particularly, a barometer for the health of the China economy. I don't necessarily agree with that, but it has to be a barometer for something. As such Fridays price action must surely be viewed as a shot across the bow of whatever copper is a barometer of.
I don't follow the base metals not tradable on the US futures markets, (such as zinc, nickel, lead etc) but apparently they have taken a bit of a hit as well.
Anyway, I think it is technically significant, and copper on the electronic market is down further this morning, the Dec contract trading a short time ago at 302.50. Base metal bears may now have something to put the wind up all those relentless bulls.
Early days yet.
Saturday, November 11, 2006
Rolling Futures Contracts
 Bill over at NoDooDahs was asking in a comments thread below about when it is prudent to roll your position from one contract to the next.
The basic answer is to know when the notice period starts (for physical delivery contracts) or to otherwise keep an eye on open interest and volume.
We have an example occuring at the moment in Cotton, and it helps to see the charts to see exactly what is happening. The 1st notice day for Dece
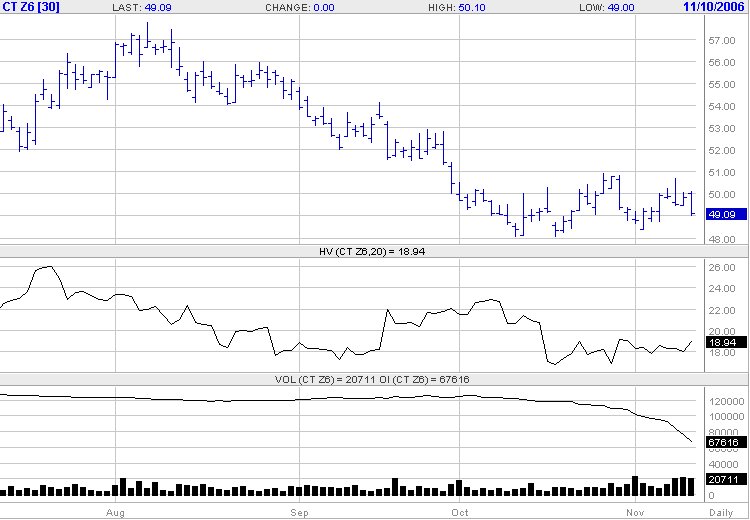 mber delivery is November 22, as detailed at the NYBOT. So any speculative traders not intending to participate in delivery had better be out of the December contract by then. We can see in the charts that this is already occurring.
Open interest in the March contract has now overtaken OI in the Dec and for all intents and purposes, March is now the spot contract. Traders are either starting to roll out now, and/or initiating any new positions in the March contract instead.
For a trader, liquidity is paramount in avoiding slippage as much as possible, therefore you wouldn't want to let volume and OI dry up too much before rolling out. It's a judgement call that can be affected by when you anticipate exiting the trade. If an exit is imminent for whatever reason, you wouldn't want to be flipping contracts and incurring costs for no benefit.
If I was in a position trade in the Dec contract here, and anticipated holding the position for a bit longer, I would be looking to roll out at any time now. The exact timing is not usually of any consequence in this situation.
Interestingly, cash settled contracts OI behave the same way. Dec Lean Hogs, a cash settled contract, trade right up till the 14th of December (more than a month left to trade), yet the Feb contract now has higher OI (see charts here). Obviously a close eye on OI and volume is requires here also.
Friday, November 10, 2006
A Slight Glitch in My Crude Oil Hypothesis
It seems that the "International Energy Agency trimmed its 2006 global oil-demand growth forecast, citing lower third-quarter demand from China and some industrialized nations " as reported in Marketwatch today.
This has put a bit of a dampener on all of us who are long Crude with what seems to me to be a veiled projection of an approaching recession. I'm quite prepared to go along with that scenario, but I still see other upward pressures on Crude; not the least of which is the prevailing US foreign policy, either directly or indirectly. I don't think the Democrat win in the mid-terms will change much on that front.
I'll be staying long, and options are cheap enough to put a floor under the price action.
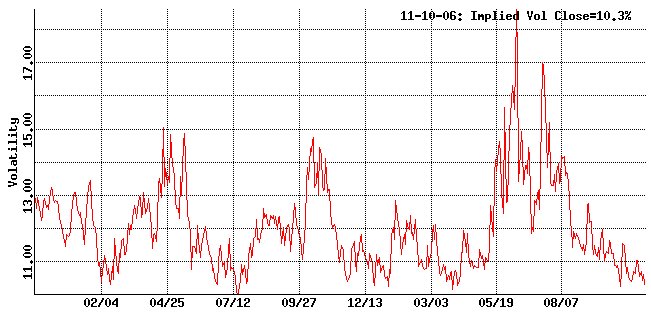
US Dollar Index
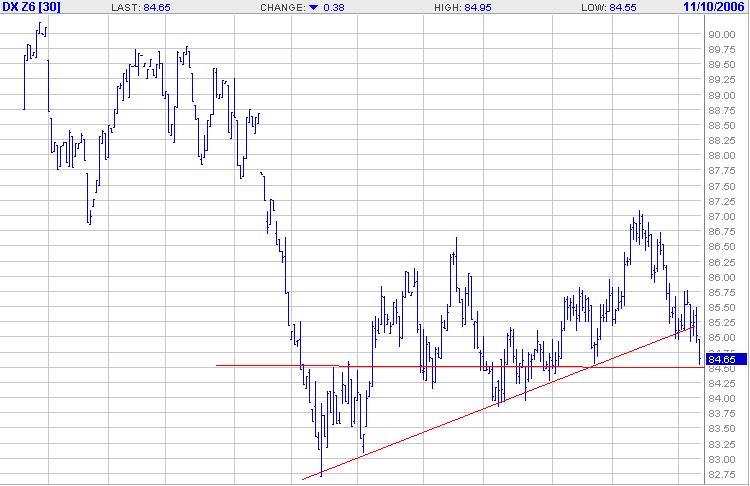 There has been much discussion about the future of the dollar in recent years, mostly based on the fundamentals of the US economy, inflation, interest rates, money supply, whatever.
My simplistic view is bearish. However the maladies afflicting the dollar are also endemic in the other western currencies... particularly the anglosphere.
In cases where I haven't really got a clue, which pretty much includes everything, I'll just resort to charts. lol
Technical analysis can be an extremely subjective study at the best of times, as is this look at the US dollar. Depending where a traders draws support/resistance, trendlines etc can give completely different pictures. The dollar has either broken support or is sitting at support, depending on which line you want to believe.
Either way, I think we are a pivotal juncture in the dollar, and the next few days could reveal the medium term future of such.
I'll be keeping an eye on it. Stay tuned.
More on the S&P 500
Dare we call it a top?
I stopped looking at leading indicators on the SP about 6 weeks ago, once I twigged there was a US election approaching.... indeed, I stopped looking at any sort of indicator at all. The only strategy that was working was:
Buy Dips!! lol
But the technical pattern I mentioned in the previous post is not being lost on the rest of the trading community either (Well of couse not! Sharp as tacks all you lot :) )
I was going to post some charts and analysis on the SP, but it has already been done in exemplary fashion by other bloggers such as Trader Mike. Rather than repeating that in my own words, best to go to Mike's blog where he asks this question - Can You Say Distribution? - and discusses exactly what we've all been thinking.
With the political imperative for a rising stock market now passed, it will be interesting from an analysis point of view, to see what happens next.
Put options are cheap too, and long vega is an attractive proposition, should a correction be in the cards.
Thursday, November 09, 2006
It Can't Be True; Can It?
Looking at the S&P500 this afternoon, I could swear that I'm seeing some resistance at 1394-95 (on the futures). That not possible, is it. That couldn't be a double top in the process of revealing itself, could it.
I mean, this Stock market has slain the bears, humiliated all but the most stubborn of them into a morose subserviance. This market is going up forever, without ever having to worry about retracements ever again, with VIX gang-nailed to the floor
Well that's how it was looking up till the election... oh crap! That's my cynicism coming out again.
I'll have a look at indicies over the coming days for some signs of normality, maybe even dust off my bear suit. lol
Oil Can Now Rise!
 Well now that the US mid-term elections are out of the way, there is now no compelling and urgent reason for the price of crude oil down be under $60.....
.....oops! Did I insinuate something there? Nah! I'm sure it was just normal market forces :)
Anyway, Oil has broken out of its downtrending channel (with Unleaded and Heating Oil looking similar) as indicated on the chart.
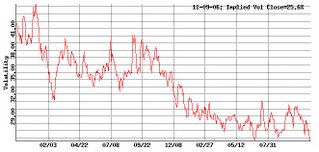
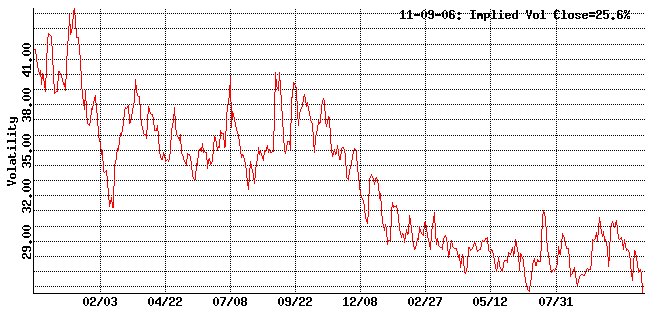
IV is rock bottom of its two year range at 26% and with Statistical Volatility at 31%, options look cheap here. Any long vega, long delta strategies look good to me.
Feeders - IV Breaks Out
 Feeder Cattle Implied Volatility mean has made a 2 year high at over 21% yesterday on the back of some fairly serious tankage over the last 2 months.
There is something important to note here in that IV's were at 2 year lows two months ago also. Some sort of long vega strategy would have done very well if the direction was picked correctly or if delta was neutral. IV has doubled in that time.
 The other thing to note at present is that though the Statistical Volatility is relatively high at 14%, this is substantially lower than the IV.
If a trader believes that the volatility on the underlying may peak about here, or even decline, a good case could be made for this being at, or close to an IV peak here. An ideal spot to go short vega, or in other words sell some option premium.
Looking at the price chart, a firm conviction of where price is headed (or not headed) would be required also. Not a lot of lead from the skews though.
Just a heads up. as ever do your own research
Wednesday, November 08, 2006
Selling Some Premium on Grains
Todays price action in Grains just look toppy to me as they sell off the highs. I'm taking some off the table and selling some calls as per my previous post.
Time to lighten off some gold as well.
Payday
Time to lighten off some gold as well.
Payday
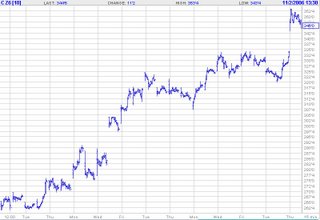
Corn making new highs...

....again, causing much whooping and hollering in the Avalon trading room....again.
Elsewhere there is a lot of bullishness on corn as well. Peter Korda od Slipka Financial Partners has made a pretty compelling case for all time highs in 2007 over at The Commodity Trader.
I'm quite happy to agree with him on this point.
Options are carrying a lot of IV so some covered calls might make good sense if this looks like consolidating in the near future, which it doesn't. Wheat has done so over the last couple weeks so who knows.
Thursday, November 02, 2006
WTF am I doing here?
 I never thought people were interested in the anonymous writers of trading blogs until a "comrade in arms" showed me the stats on his "about me" page. I must admit to being a bit reticent about waxing lyrical about myself.
The reason for this is that, as I've gotten older, I've become progressively more anti-ego, anti-snob, anti-bourgeois and more interested in the whimsical and esoteric (as the title of this blog alludes to). Yep, I've turned into a bohemian. A hippie trader. LOL
Yet, the creation of a blog and thrusting at it the world seems so much like an act of the ego. Hmmmm.....
 I basically trade the liquid futures markets for a living... Various Commodities, Stock Indicies and Treasuries. If I can do it with an option strategy to limit risk, all the better, but I'm not averse to plonking straight out with futures.
I think a diary in the form of a blog helps to organize a rational trading process; if I have a thought, it has to make sense to the 3 people who read this over the next few years. It is also really cool to be part of a community of traders via the "blogosphere", for want of a better word (Gawd howe I hate that word lol).
So starts the experiment.
Gold - Yup! Let's Call it a Breakout.
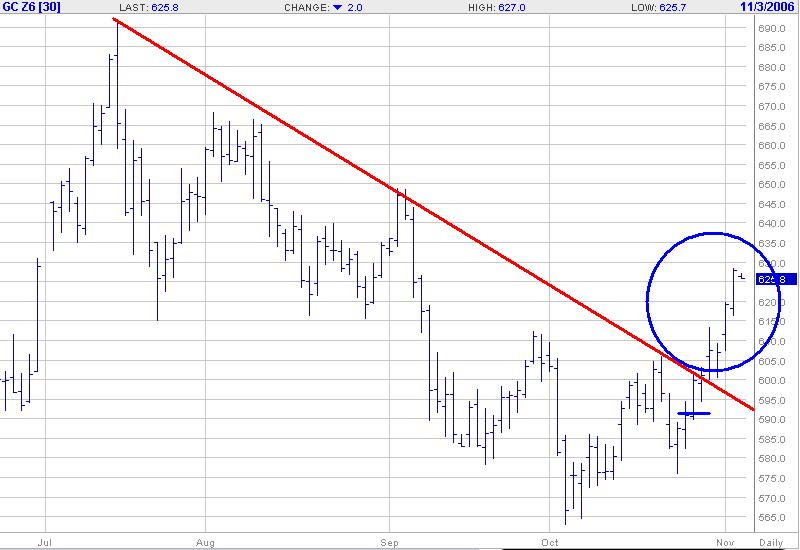 I called it here . Sure enough, it's broken through the trendline. Very basic TA here.
But the gold bugs are all aflutter; with this pragmatic Avalonian fluttering in unison. Something to cheer about while I wait for the stock-market to give a short signal.
Oh wait! The SP500 went down 10 points or so yesterday for the first time in, like 500 days! But I'm waiting for the cavalry to show up, those merciless dip buyers. (or is it the GOP doing all the buying, lol)
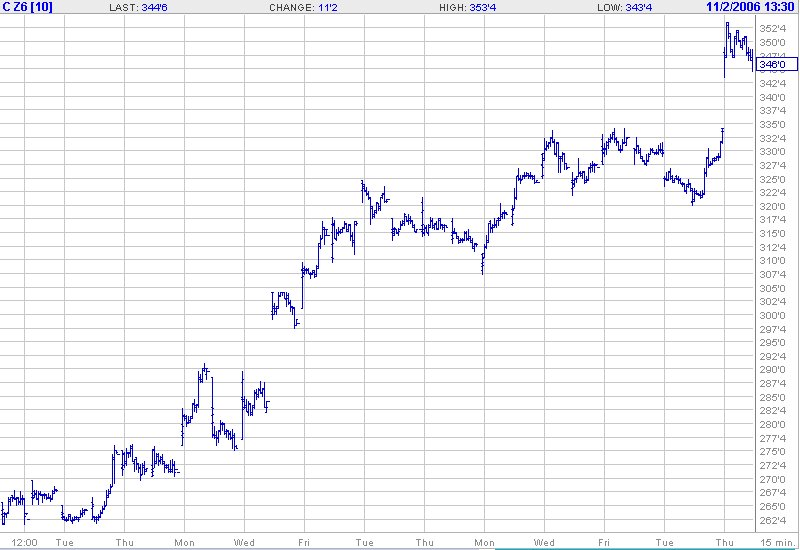
Grains Awesome
Funny thing this blogging. I am quite certain that not a single person will read this except me. There must be a million blogs in the same boat. Ah well, maybe some archeologists will extract this from the electronic ether someday and find out that Grain futures were humming way back in October/November 2006.
 Dec Corn went limit up briefly today causing a bit of excitement in the Avalon trading room. I've been long grains for quite some time, adding or subtracting contracts as I go along.
Fortuitiously I added some contracts yesterday. Todays action looks sus'... a shooting star for those candlestick enthusiasts. So I took those extra contracts off. Nice enough trade.
Elsewhere in the CBOT grain pits, Soybeans look similar to corn, but wheat looking decidedly weaker.
Not that I'm bearish on the grains, but ferchrissake we must be due a reasonable retracement... unless these markets have decided to copy stocks and go straight up forever.
Subscribe to:
Posts (Atom)


