 Last week I opined that I would really have to get my trading act together to cope in the potential price rise at Mrs's favourite cafe'. A happy wife is a happy life, so rather than put the khyber on her cafe' society spending, I'll just have to step up my trading performance.
That must mean even more trend-lines right? LOL
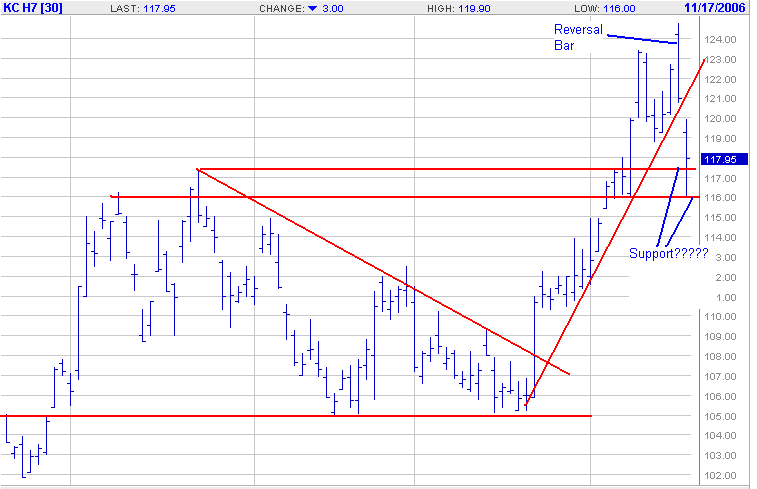
Thursdays bar was a grade A reversal, with some solid resistance at the ~125 level for this contract* (not shown on this chart) triggering some solid selling to close lower for the day.
*N.B. Drawing horizontal trendlines can be a challenge with futures because of the cost of carry/contango/backwardation. What mat be a lovely support or resistance on the individual contract, might not be valid on a continuous chart and visa-versa. So a grain of salt is required.
Friday saw the month old trend-line broken with conviction but with some buying off the lows and closing above the August resistance areas (now support?)
My view of support and resistance goes something like this: Support (resistance) isn't support until there is support. In other words, I am watching price action around these arbitrarily drawn lines on the chart for low risk entries (or pyramiding opportunities).
So is there support at the support in this March
 coffee contract. There is some evidence but no "case closed" yet, and there's still the fib levels below here.
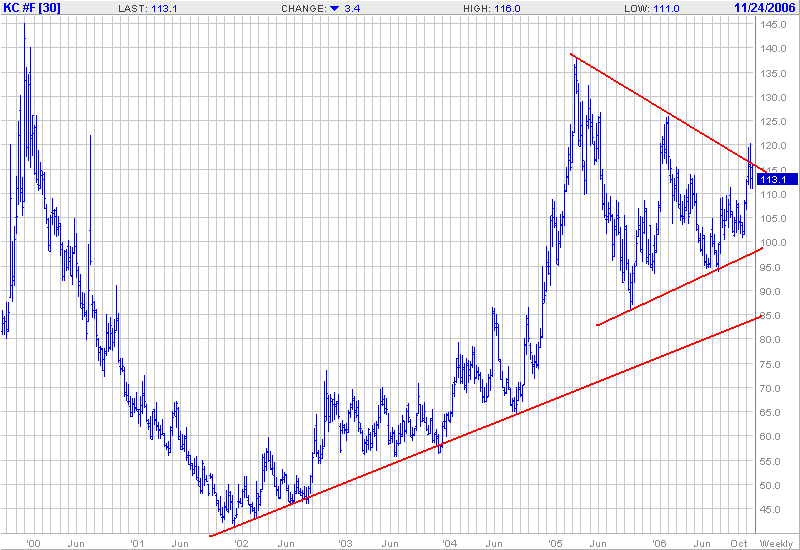
The next question is, is whether this market is in an "El Toro Grande" ( To steal Stuie Johnstons terminology) or just trading within a somewhat messy range?
It is a question that can only be answered with certainty, in retrospect: But one must put their chips on the table.... and if Alfredo the Barista is going to end up charging a fiver for a cup of coffee, I am going to slap that fiver on the counter with fiscal impunity, dammit!


No comments:
Post a Comment