 Feeder Cattle Implied Volatility mean has made a 2 year high at over 21% yesterday on the back of some fairly serious tankage over the last 2 months.
There is something important to note here in that IV's were at 2 year lows two months ago also. Some sort of long vega strategy would have done very well if the direction was picked correctly or if delta was neutral. IV has doubled in that time.
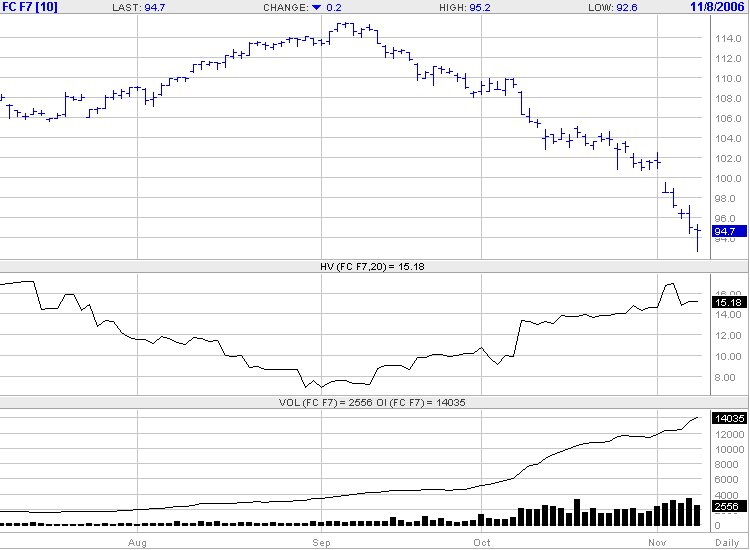 The other thing to note at present is that though the Statistical Volatility is relatively high at 14%, this is substantially lower than the IV.
If a trader believes that the volatility on the underlying may peak about here, or even decline, a good case could be made for this being at, or close to an IV peak here. An ideal spot to go short vega, or in other words sell some option premium.
Looking at the price chart, a firm conviction of where price is headed (or not headed) would be required also. Not a lot of lead from the skews though.
Just a heads up. as ever do your own research


No comments:
Post a Comment