Tuesday, November 14, 2006

Dollar - Which Way?

Last Friday, I mused that the US Dollar Index was at a pivotal juncture with regards to the technical picture.

Pivotal was the correct term, because thats exactly what it did at the support I had drawn in - pivot. This isn't necessarily bullish... yet. There is a month old downward channel to contend with as drawn in on the left. That horizontal support at 84.50ish is still key and a move out of this channel will validate that support and essentially set a bullish path in the medium term.

On the other hand, most of the currencies the USD trades against look technically bullish as well. A move down today continues the channel.

Which way?

Monday, November 13, 2006

VIX Deceased


I have mentioned in earlier posts that I have stopped looking at leading indicators such as put/call ratios, VIX etc as they stopped making any sense, sans any sort of normal wave structure in the stock indicies.

Only one thing made sense - buy dips; not retracements, they don't exist anymore, dips. Any dip!

Old habits die hard, so today I once again perused the VIX for any sign of activity, to find that, ironically, it slipped away in the night, unnoticed by anyone.

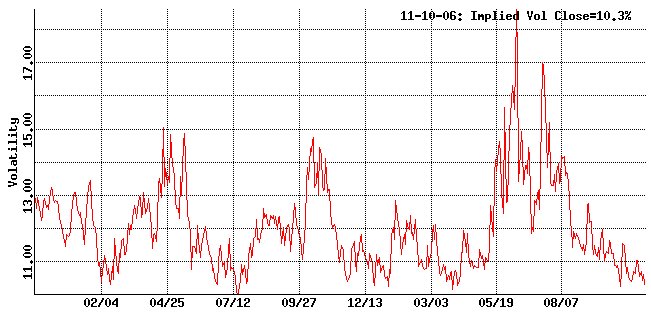
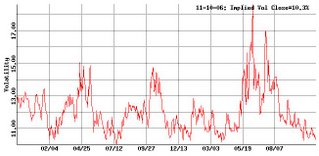
Anyway, nobody needs me to tell them that S&P 500 IV's are at basically their minimum value. We have not seems them much lower... ever. Adam Warner has discussed VIX at length over at The Daily Options Report, so have a look there for a comprehensive run-down.

Minimum value is a concept I like to use in the commodities markets. When cocoa producers start burning there crops in the streets as they did a few years ago in the Ivory Coast, it's time to take a position.

So can that logic be extended to stock market volatilities? I think so, but cautiously so, as all logic has apparently been suspended. Buying cheap volatility, of course means buying puts, because it is from downside where we will get a lift in vols.

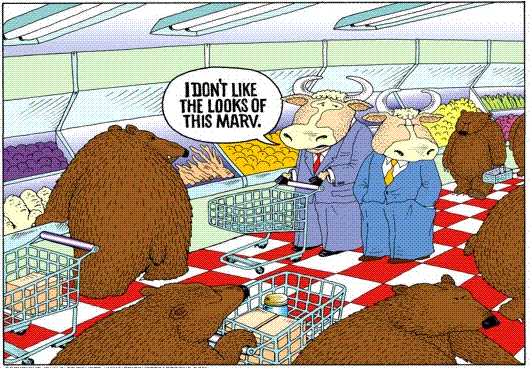
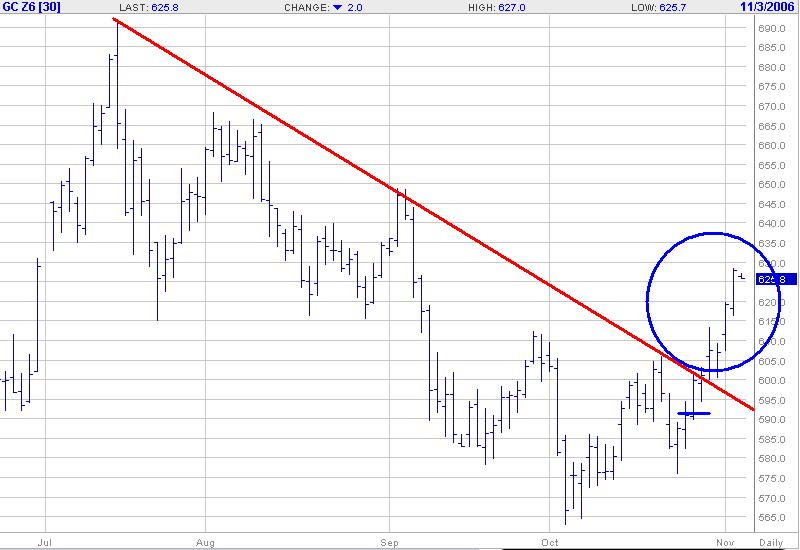
Hmmm well there is that potential double/triple top.... the election is past.... the bears are looking a bit more credible.

However, the bobbleheads are talking up a storm (as ever), oil refuses to rise despite my best analysis, and apparently a slowing economy (and therefore a pause) is bullish!

Confounding!

There is a strategy that suits low volatilities, is long vega on the downside and can be profitable even if the SP goes up - the "reverse ratio spread" (aka "put backspread"). We short ITM puts and buy OTM puts in a ratio (usually 2:1 but can be any ratio... 3:2, 3:1 whatever)

The risk is similar to a long straddle and maximum loss is at the bought strike.

I'll talk more about this in the coming days as we watch how this market shapes up.
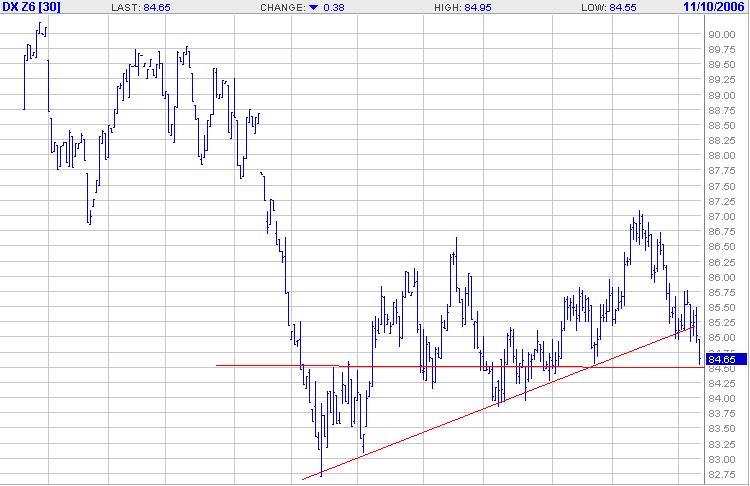
Cracks in Copper

Many of my commodity trading colleagues (and those who trade them via share-market proxies) are relentlessly bullish on base and precious metals. The secular trend in these metals makes it difficult to argue with them without appearing to be a total neg-head.

They will point to the fundamentals of ever increasing demand and dwindling supply. The opinions of one Jim Rodgers gives them great heart and courage of their convictions.

They could be right, but I'm not a believer on two fronts. 1/I think we are headed for a recession (I will leave the argument on that front to more formally educated pundits) and 2/ Psychologically I don't want to be a believer in anything. I just want to trade what I see, without bias.

Which brings me to the point of this post - Copper.

Many view copper as a barometer for the global economy and particularly, a barometer for the health of the China economy. I don't necessarily agree with that, but it has to be a barometer for something. As such Fridays price action must surely be viewed as a shot across the bow of whatever copper is a barometer of.

I don't follow the base metals not tradable on the US futures markets, (such as zinc, nickel, lead etc) but apparently they have taken a bit of a hit as well.

Anyway, I think it is technically significant, and copper on the electronic market is down further this morning, the Dec contract trading a short time ago at 302.50. Base metal bears may now have something to put the wind up all those relentless bulls.

Early days yet.

Saturday, November 11, 2006

Rolling Futures Contracts

Bill over at NoDooDahs was asking in a comments thread below about when it is prudent to roll your position from one contract to the next.

The basic answer is to know when the notice period starts (for physical delivery contracts) or to otherwise keep an eye on open interest and volume.

We have an example occuring at the moment in Cotton, and it helps to see the charts to see exactly what is happening. The 1st notice day for December delivery is November 22, as detailed at the NYBOT. So any speculative traders not intending to participate in delivery had better be out of the December contract by then. We can see in the charts that this is already occurring.

Open interest in the March contract has now overtaken OI in the Dec and for all intents and purposes, March is now the spot contract. Traders are either starting to roll out now, and/or initiating any new positions in the March contract instead.

For a trader, liquidity is paramount in avoiding slippage as much as possible, therefore you wouldn't want to let volume and OI dry up too much before rolling out. It's a judgement call that can be affected by when you anticipate exiting the trade. If an exit is imminent for whatever reason, you wouldn't want to be flipping contracts and incurring costs for no benefit.

If I was in a position trade in the Dec contract here, and anticipated holding the position for a bit longer, I would be looking to roll out at any time now. The exact timing is not usually of any consequence in this situation.

Interestingly, cash settled contracts OI behave the same way. Dec Lean Hogs, a cash settled contract, trade right up till the 14th of December (more than a month left to trade), yet the Feb contract now has higher OI (see charts here). Obviously a close eye on OI and volume is requires here also.

Friday, November 10, 2006

A Slight Glitch in My Crude Oil Hypothesis

It seems that the "International Energy Agency trimmed its 2006 global oil-demand growth forecast, citing lower third-quarter demand from China and some industrialized nations " as reported in Marketwatch today.

This has put a bit of a dampener on all of us who are long Crude with what seems to me to be a veiled projection of an approaching recession. I'm quite prepared to go along with that scenario, but I still see other upward pressures on Crude; not the least of which is the prevailing US foreign policy, either directly or indirectly. I don't think the Democrat win in the mid-terms will change much on that front.

I'll be staying long, and options are cheap enough to put a floor under the price action.

US Dollar Index

There has been much discussion about the future of the dollar in recent years, mostly based on the fundamentals of the US economy, inflation, interest rates, money supply, whatever.

My simplistic view is bearish. However the maladies afflicting the dollar are also endemic in the other western currencies... particularly the anglosphere.

In cases where I haven't really got a clue, which pretty much includes everything, I'll just resort to charts. lol

Technical analysis can be an extremely subjective study at the best of times, as is this look at the US dollar. Depending where a traders draws support/resistance, trendlines etc can give completely different pictures. The dollar has either broken support or is sitting at support, depending on which line you want to believe.

Either way, I think we are a pivotal juncture in the dollar, and the next few days could reveal the medium term future of such.

I'll be keeping an eye on it. Stay tuned.

More on the S&P 500


Dare we call it a top?

I stopped looking at leading indicators on the SP about 6 weeks ago, once I twigged there was a US election approaching.... indeed, I stopped looking at any sort of indicator at all. The only strategy that was working was:

Buy Dips!! lol

But the technical pattern I mentioned in the previous post is not being lost on the rest of the trading community either (Well of couse not! Sharp as tacks all you lot :) )

I was going to post some charts and analysis on the SP, but it has already been done in exemplary fashion by other bloggers such as Trader Mike. Rather than repeating that in my own words, best to go to Mike's blog where he asks this question - Can You Say Distribution? - and discusses exactly what we've all been thinking.

With the political imperative for a rising stock market now passed, it will be interesting from an analysis point of view, to see what happens next.

Put options are cheap too, and long vega is an attractive proposition, should a correction be in the cards.

Thursday, November 09, 2006

It Can't Be True; Can It?

Looking at the S&P500 this afternoon, I could swear that I'm seeing some resistance at 1394-95 (on the futures). That not possible, is it. That couldn't be a double top in the process of revealing itself, could it.

I mean, this Stock market has slain the bears, humiliated all but the most stubborn of them into a morose subserviance. This market is going up forever, without ever having to worry about retracements ever again, with VIX gang-nailed to the floor

Well that's how it was looking up till the election... oh crap! That's my cynicism coming out again.

I'll have a look at indicies over the coming days for some signs of normality, maybe even dust off my bear suit. lol

Oil Can Now Rise!

Well now that the US mid-term elections are out of the way, there is now no compelling and urgent reason for the price of crude oil down be under $60.....

.....oops! Did I insinuate something there? Nah! I'm sure it was just normal market forces :)

Anyway, Oil has broken out of its downtrending channel (with Unleaded and Heating Oil looking similar) as indicated on the chart.

IV is rock bottom of its two year range at 26% and with Statistical Volatility at 31%, options look cheap here. Any long vega, long delta strategies look good to me.

Feeders - IV Breaks Out

Feeder Cattle Implied Volatility mean has made a 2 year high at over 21% yesterday on the back of some fairly serious tankage over the last 2 months.

There is something important to note here in that IV's were at 2 year lows two months ago also. Some sort of long vega strategy would have done very well if the direction was picked correctly or if delta was neutral. IV has doubled in that time.

The other thing to note at present is that though the Statistical Volatility is relatively high at 14%, this is substantially lower than the IV.

If a trader believes that the volatility on the underlying may peak about here, or even decline, a good case could be made for this being at, or close to an IV peak here. An ideal spot to go short vega, or in other words sell some option premium.

Looking at the price chart, a firm conviction of where price is headed (or not headed) would be required also. Not a lot of lead from the skews though.

Just a heads up. as ever do your own research

Wednesday, November 08, 2006

Selling Some Premium on Grains

Todays price action in Grains just look toppy to me as they sell off the highs. I'm taking some off the table and selling some calls as per my previous post.

Time to lighten off some gold as well.

Payday

Corn making new highs...


....again, causing much whooping and hollering in the Avalon trading room....again.

Elsewhere there is a lot of bullishness on corn as well. Peter Korda od Slipka Financial Partners has made a pretty compelling case for all time highs in 2007 over at The Commodity Trader.

I'm quite happy to agree with him on this point.

Options are carrying a lot of IV so some covered calls might make good sense if this looks like consolidating in the near future, which it doesn't. Wheat has done so over the last couple weeks so who knows.

Thursday, November 02, 2006

WTF am I doing here?

I never thought people were interested in the anonymous writers of trading blogs until a "comrade in arms" showed me the stats on his "about me" page. I must admit to being a bit reticent about waxing lyrical about myself.

The reason for this is that, as I've gotten older, I've become progressively more anti-ego, anti-snob, anti-bourgeois and more interested in the whimsical and esoteric (as the title of this blog alludes to). Yep, I've turned into a bohemian. A hippie trader. LOL

Yet, the creation of a blog and thrusting at it the world seems so much like an act of the ego. Hmmmm.....

I basically trade the liquid futures markets for a living... Various Commodities, Stock Indicies and Treasuries. If I can do it with an option strategy to limit risk, all the better, but I'm not averse to plonking straight out with futures.

I think a diary in the form of a blog helps to organize a rational trading process; if I have a thought, it has to make sense to the 3 people who read this over the next few years. It is also really cool to be part of a community of traders via the "blogosphere", for want of a better word (Gawd howe I hate that word lol).

So starts the experiment.

Gold - Yup! Let's Call it a Breakout.

I called it here . Sure enough, it's broken through the trendline. Very basic TA here.

But the gold bugs are all aflutter; with this pragmatic Avalonian fluttering in unison. Something to cheer about while I wait for the stock-market to give a short signal.

Oh wait! The SP500 went down 10 points or so yesterday for the first time in, like 500 days! But I'm waiting for the cavalry to show up, those merciless dip buyers. (or is it the GOP doing all the buying, lol)

Grains Awesome

Funny thing this blogging. I am quite certain that not a single person will read this except me. There must be a million blogs in the same boat. Ah well, maybe some archeologists will extract this from the electronic ether someday and find out that Grain futures were humming way back in October/November 2006.

Dec Corn went limit up briefly today causing a bit of excitement in the Avalon trading room. I've been long grains for quite some time, adding or subtracting contracts as I go along.

Fortuitiously I added some contracts yesterday. Todays action looks sus'... a shooting star for those candlestick enthusiasts. So I took those extra contracts off. Nice enough trade.

Elsewhere in the CBOT grain pits, Soybeans look similar to corn, but wheat looking decidedly weaker.

Not that I'm bearish on the grains, but ferchrissake we must be due a reasonable retracement... unless these markets have decided to copy stocks and go straight up forever.